Project 1
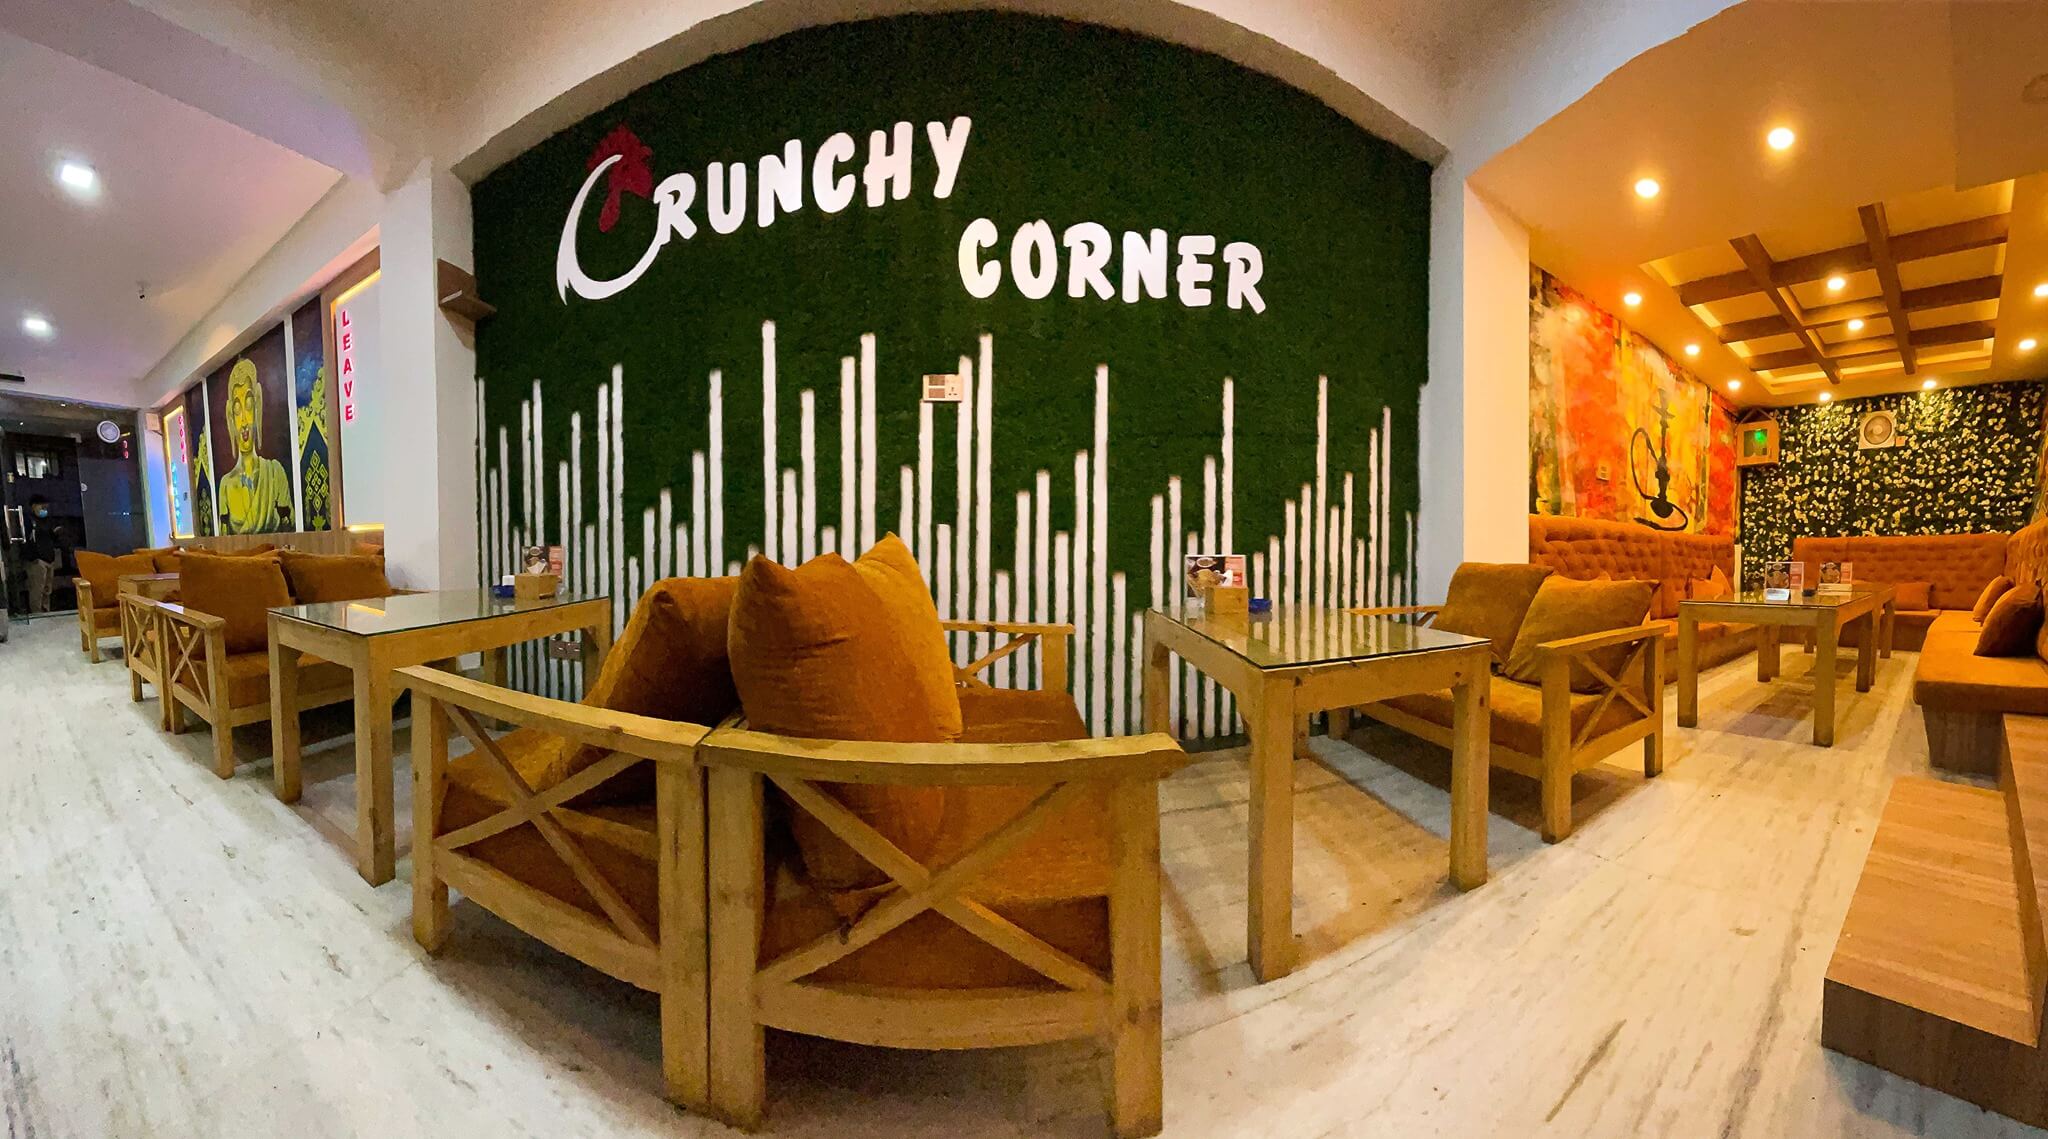
Crunchy Corner Business Optimization and Budgeting
- Utilized Power BI to develop a comprehensive dashboard for Crunchy Corner, one of India’s largest fast food chains with over 1,000 restaurants.
- Organized data into dimension and fact tables, and established relationships to generate insights.
- Analysed key financial metrics such as sales, gross profit, EBITDA, and PAT, displaying YoY changes, sales trends, and performance by category and location.
- Conducted quadrant and Pareto analysis, created variance analyses comparing actual vs. budget financials, and performed PVM analyses to optimize business operations and budgeting strategies.


Project 2
E-commerce sales Analysis of Brazilian Operations
- Analysed category sales and instalment payments, revealing 40% of orders paid in instalments and highlighting top-selling categories.
- Assessed monthly orders, product averages, and revenue contributions, finding a 20% year-over-year sales growth.
- Evaluated retention rates and top customer spend, identifying a 60% retention rate and top customers contributing 15% of total revenue.
- Leveraged SQL and Python for data transformation and visualization.

Project 3
Using Excel Data Analysis and Visualization for Sales Performance of Kevin General Store
By leveraging Excel’s powerful data analysis and visualization capabilities, this project aims to deliver clear and impactful insights into sales performance, customer contributions, and product profitability, enabling informed business decisions.

Project 4
The technological revolution is changing aspect of our lives, and the fabric of society itself. it’s also changing the way we learn and what we learn. Factual knowledge is less prized when everything you ever need to know can be found on your phone. There’s no imperative to be an expert at doing everything when you can.
